
“Half the Truth is often a great Lie.”
Benjamin Franklin, Poor Richard's Almanack (July 1758) [1]
Benjamin Franklin printed this line in Poor Richard's Almanack nearly three centuries ago. I came back to it while thinking about the temperature maps we now produce for cities.
A map can accurately describe one part of the urban environment and still lead us astray when we treat it as a complete account. Satellite thermal images are a good example. They reveal patterns we could never observe by standing at a single street corner. But the colour assigned to a road or rooftop does not, by itself, tell us the temperature of the air a pedestrian breathes.
Phoenix, Arizona, offers a particularly clear way to examine that distinction.
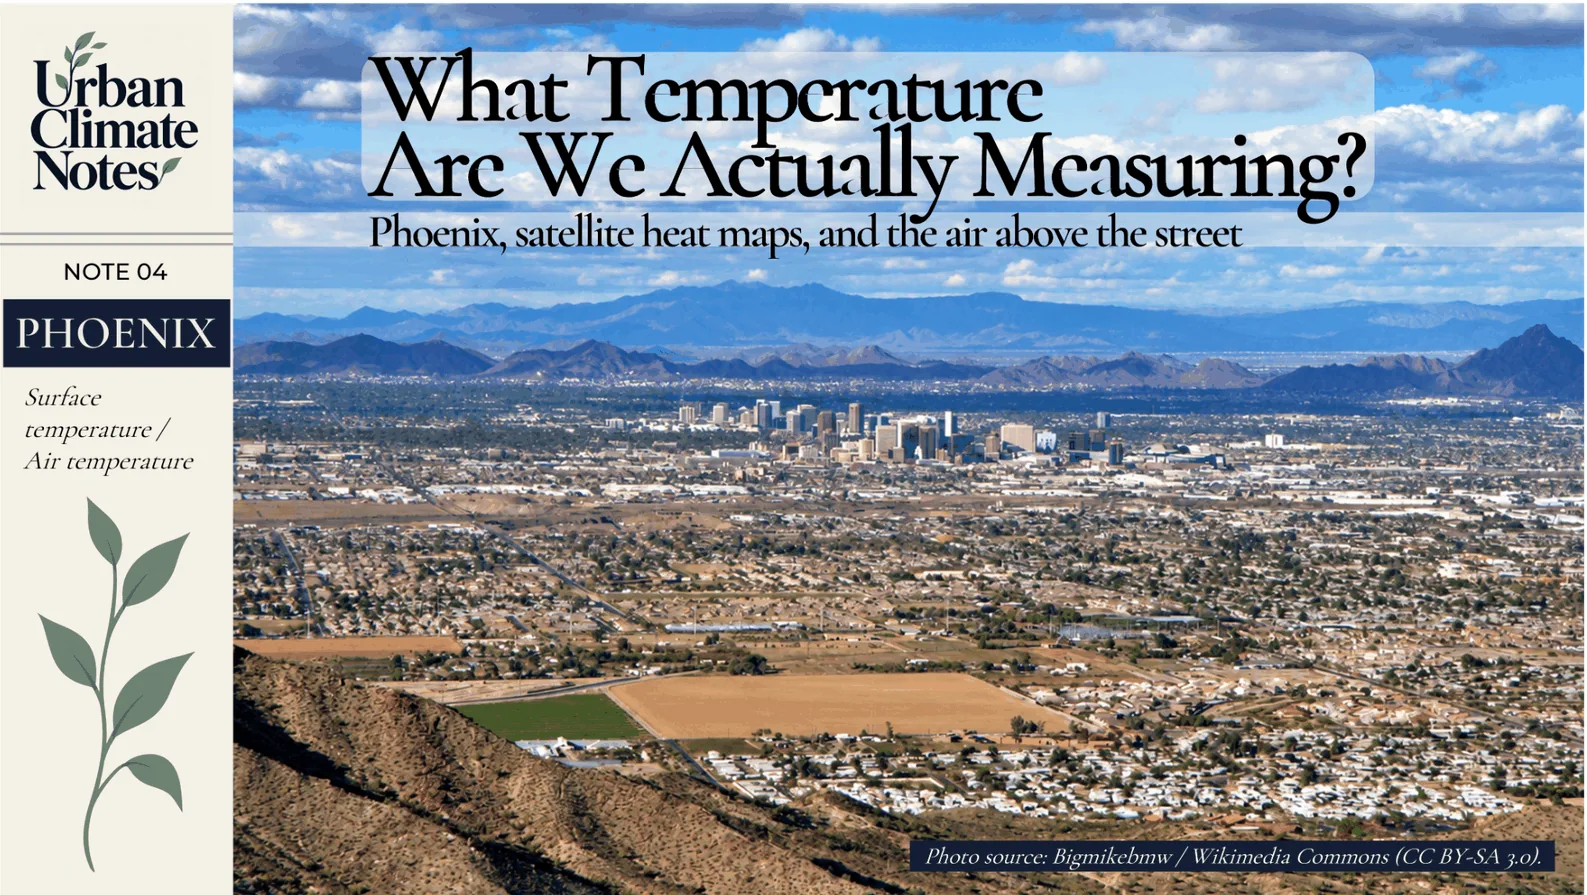
<!-- IMAGE 01 — COVER (auto-rendered by React article card; do not duplicate in body). File: ../images/notes/04/01_Urban_Climate_Notes_Cover.png Original photograph: Bigmikebmw, Downtown Phoenix from South Mountain (10 Feb 2009). Source: https://commons.wikimedia.org/wiki/File:Phoenix,_Arizona.JPG License: CC BY-SA 3.0. Cropped, resized and combined with separate title/brand elements. -->One city, two temperatures
At 1:02 p.m. local time on 19 June 2024, NASA's ECOSTRESS instrument, mounted on the International Space Station, observed the surface temperatures of Phoenix. Its map showed roads and adjoining sidewalks exceeding 49°C in several parts of the city. Some surfaces around Phoenix Sky Harbor International Airport reached approximately 60°C. [2]
The air temperature recorded at the airport that day reached 43°C.
These two numbers often invite a simple subtraction. But the 60°C surface observation and the 43°C daily air-temperature maximum were not simultaneous measurements at precisely the same spot. Their difference must not be presented as a measured 17°C air–surface gap.
There is also a more basic distinction. ECOSTRESS observed thermal radiation from exposed surfaces. The airport weather station measured the surrounding air. Both records are useful, and each answers a different question.
The Phoenix image was processed to display a 30-metre grid using a machine-learning sharpening approach combining ECOSTRESS with Landsat and Sentinel-2 information. That enhanced detail is useful, provided we remember how the map was produced. [2]
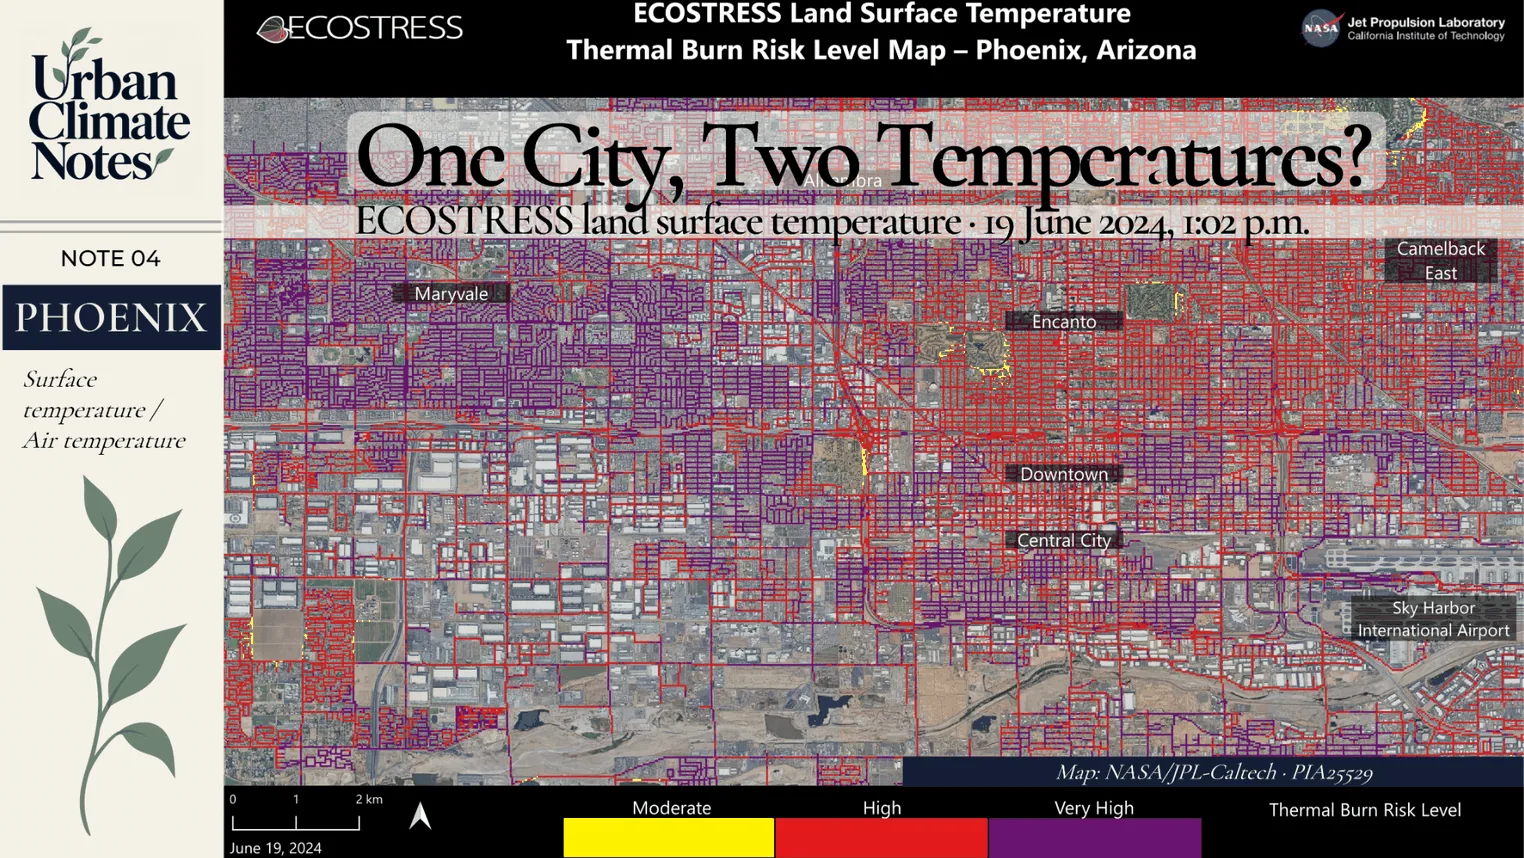
Phoenix surface temperature and thermal burn risk on 19 June 2024 at 1:02 p.m. local time. This is a satellite-derived map of exposed surfaces, not a measurement of air temperature. Its scale, observation time and legend must remain visible in the published image. Source: NASA/JPL-Caltech, PIA25529.
The surface a satellite sees
Thermal infrared instruments detect radiation emitted by the Earth's surface. Retrieving land surface temperature (LST) from those observations requires accounting for the atmosphere and the emissivity of different materials. [3]
In a city, the sensor may see asphalt, rooftops, exposed soil or the upper canopy of a tree. A shaded pavement beneath that tree may not be visible from space at all.
A person walking along the same street encounters the surrounding air, direct and reflected sunlight, wind and thermal radiation from nearby surfaces. The temperature of a canopy, a wall or a road is part of that experience, but no single one of those measurements describes the whole environment.
Air temperature is generally measured with a thermometer appropriately shielded from solar radiation and exposed to the ambient air. It is influenced by the surfaces below and around it, yet it does not simply match their temperature.
For this reason, I am careful about what a satellite heat map allows me to say. It can show where exposed surfaces are warmer. An air-temperature map requires different observations or a model designed to estimate air temperature.
Aerial photography helps put those surfaces in context. The former University of Phoenix Stadium, located in Glendale within Greater Phoenix, brings a very large roof, paved areas and agricultural fields into a single view. The photograph illustrates contrasting land covers; it does not establish that one surface was hotter than another.

The former University of Phoenix Stadium in Glendale, Greater Phoenix, photographed in February 2008. Different land covers are visible, but their temperatures were not measured in this photograph. Photo: Gerald Nino / U.S. Customs and Border Protection, U.S. federal public domain; resized and framed.
What recent research found
A 2026 study by Yiwen Zhang and colleagues in Nature Communications examined how substantially these two measurements can diverge. The researchers developed a transfer-learning framework for estimating near-surface urban air temperature in 384 cities across the contiguous United States. Their estimates were produced at approximately 1-kilometre resolution for 2013–2023, at around 1:30 a.m. and 1:30 p.m. local time. [4]
The air temperatures were model estimates, trained and evaluated using available observations. There was no thermometer at every mapped pixel.
When the authors compared their estimated air temperatures with satellite surface temperatures, they found important differences in magnitude and spatial pattern. Across the cities studied, surfaces tended to be warmer than the air during the day and often cooler at night. The strength of the relationship varied with local climate and location within the city.
Their analysis also found that using satellite LST as a substitute for near-surface air temperature could overstate urban heat-exposure magnitude and differences between neighbourhoods. These are findings for the study's defined data, model and US cities; they should not be turned into a universal conversion factor. [4]
I find the planning implication especially important. The hottest-looking neighbourhood on a surface map might indeed contain the hottest pavements or rooftops. It does not follow that its air-temperature difference from adjacent neighbourhoods is equally large.
An aerial photograph of a residential neighbourhood in Arizona shows why even a familiar urban landscape contains different surfaces: roofs, streets, school grounds, vegetation and irrigated plots. It gives us possible sites for further measurement. The image alone cannot identify a hot spot or quantify heat exposure.
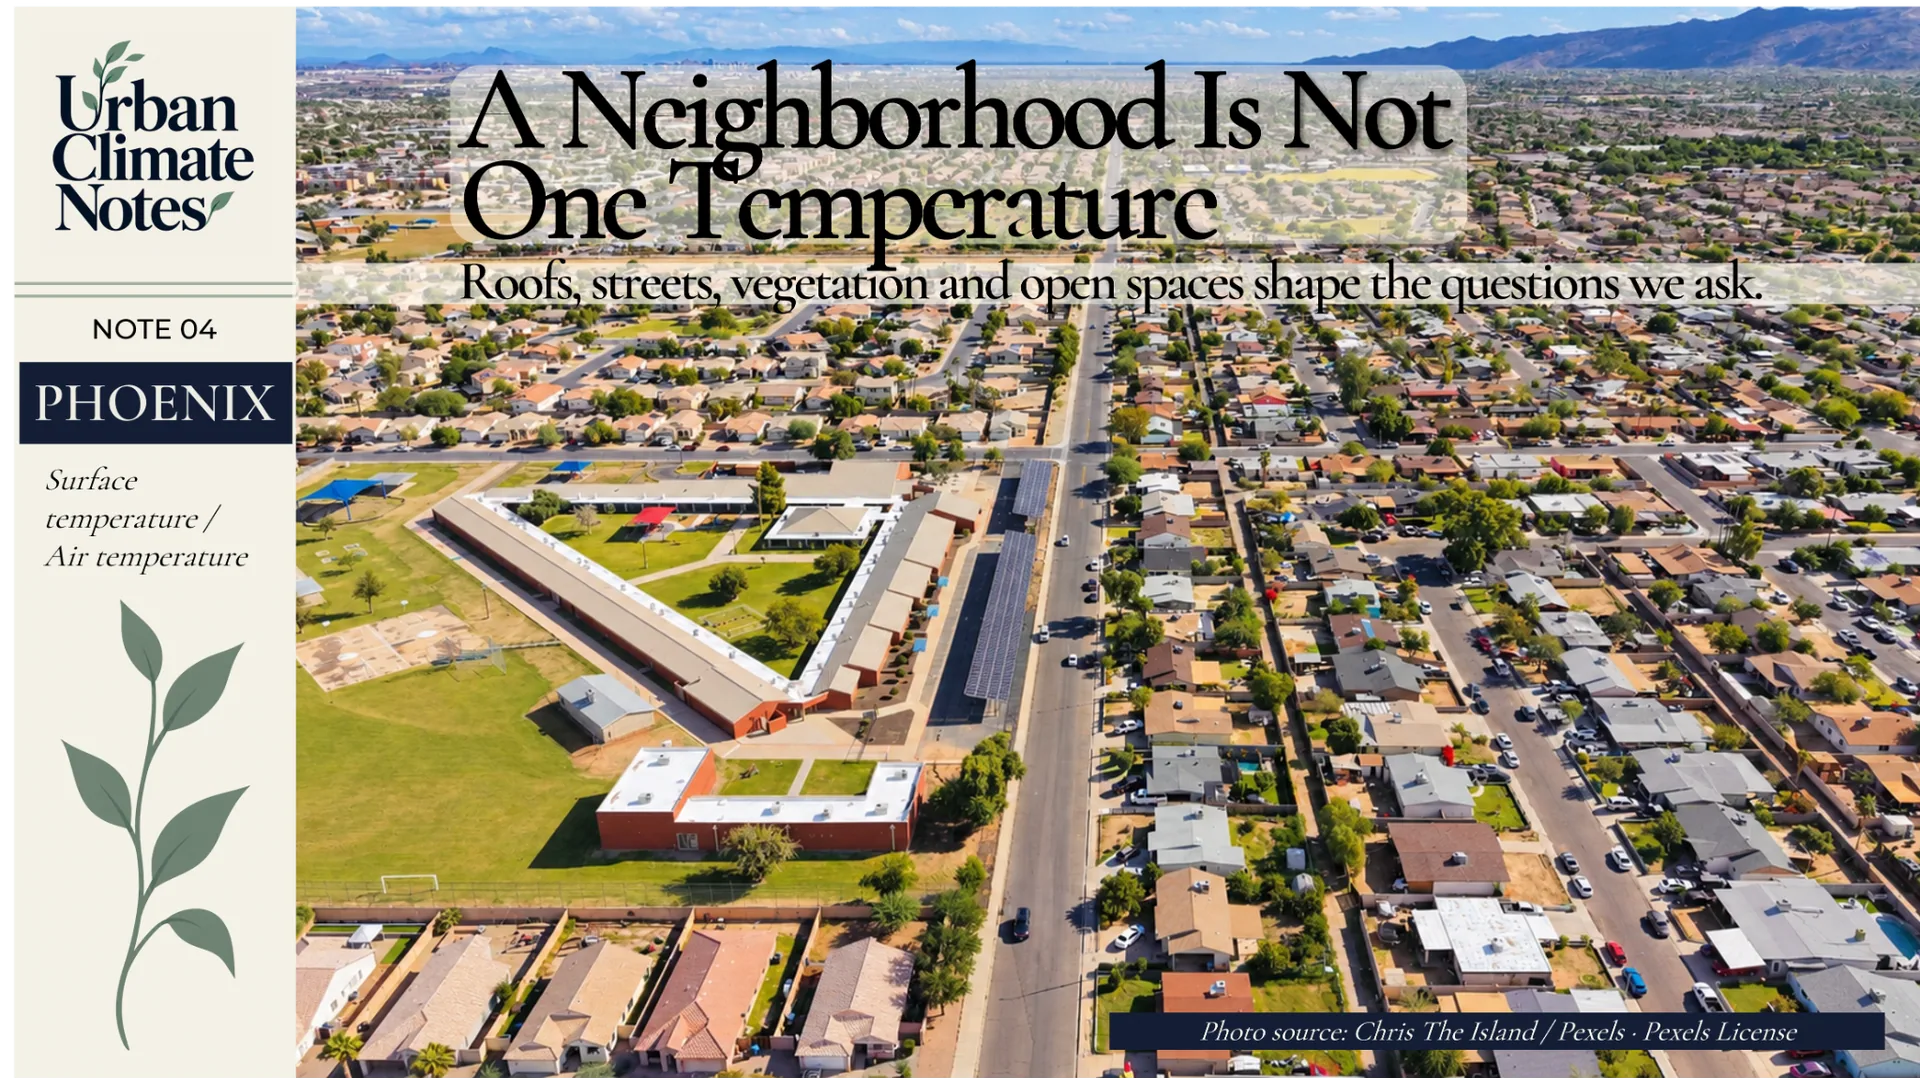
Residential neighbourhood in Arizona. The aerial view illustrates land-cover diversity, not observed air or surface temperatures. Photo: Chris The Island / Pexels, Pexels License; resized, cropped and framed.
The heat a person encounters
Consider two people waiting for public transport in Phoenix on the same afternoon. One is standing in direct sunshine. The other is a few metres away beneath a shelter.
The air temperature at their locations might be nearly identical, while their exposure to solar radiation differs substantially. Wind, humidity and the warmth of the surrounding surfaces further influence how much heat their bodies gain or lose.
The Heat Index combines air temperature and relative humidity and is generally interpreted for shaded conditions. Wet Bulb Globe Temperature (WBGT) incorporates additional influences, including radiant exposure and wind. Neither of these indices is interchangeable with satellite LST. [5]
If we want to evaluate a bus stop, pedestrian route or schoolyard, our measurements need to correspond to the physical conditions people actually encounter. A satellite map can identify promising locations for closer investigation. It cannot replace that investigation.
What stays warm after sunset?
Phoenix also connects to the nighttime cooling question discussed in Urban Climate Notes 02, about Tokyo.
During the July 2023 heatwave, NASA researchers examined another set of Phoenix surface-temperature observations from the VIIRS instrument aboard the NOAA–NASA Suomi NPP satellite. These were collected at about 2 a.m. on several nights. Some built surfaces remained near 38°C long after sunset, and the mapped surfaces became progressively hotter during part of the heatwave. [7]
These were nighttime surface temperatures. They were not direct readings of the air two metres above the ground. The observations nevertheless help explain why material properties and heat storage matter to a city's nighttime thermal environment.
Surface and atmospheric urban heat islands can differ in strength, timing and location. The time and method of observation belong in every interpretation of an urban heat map.
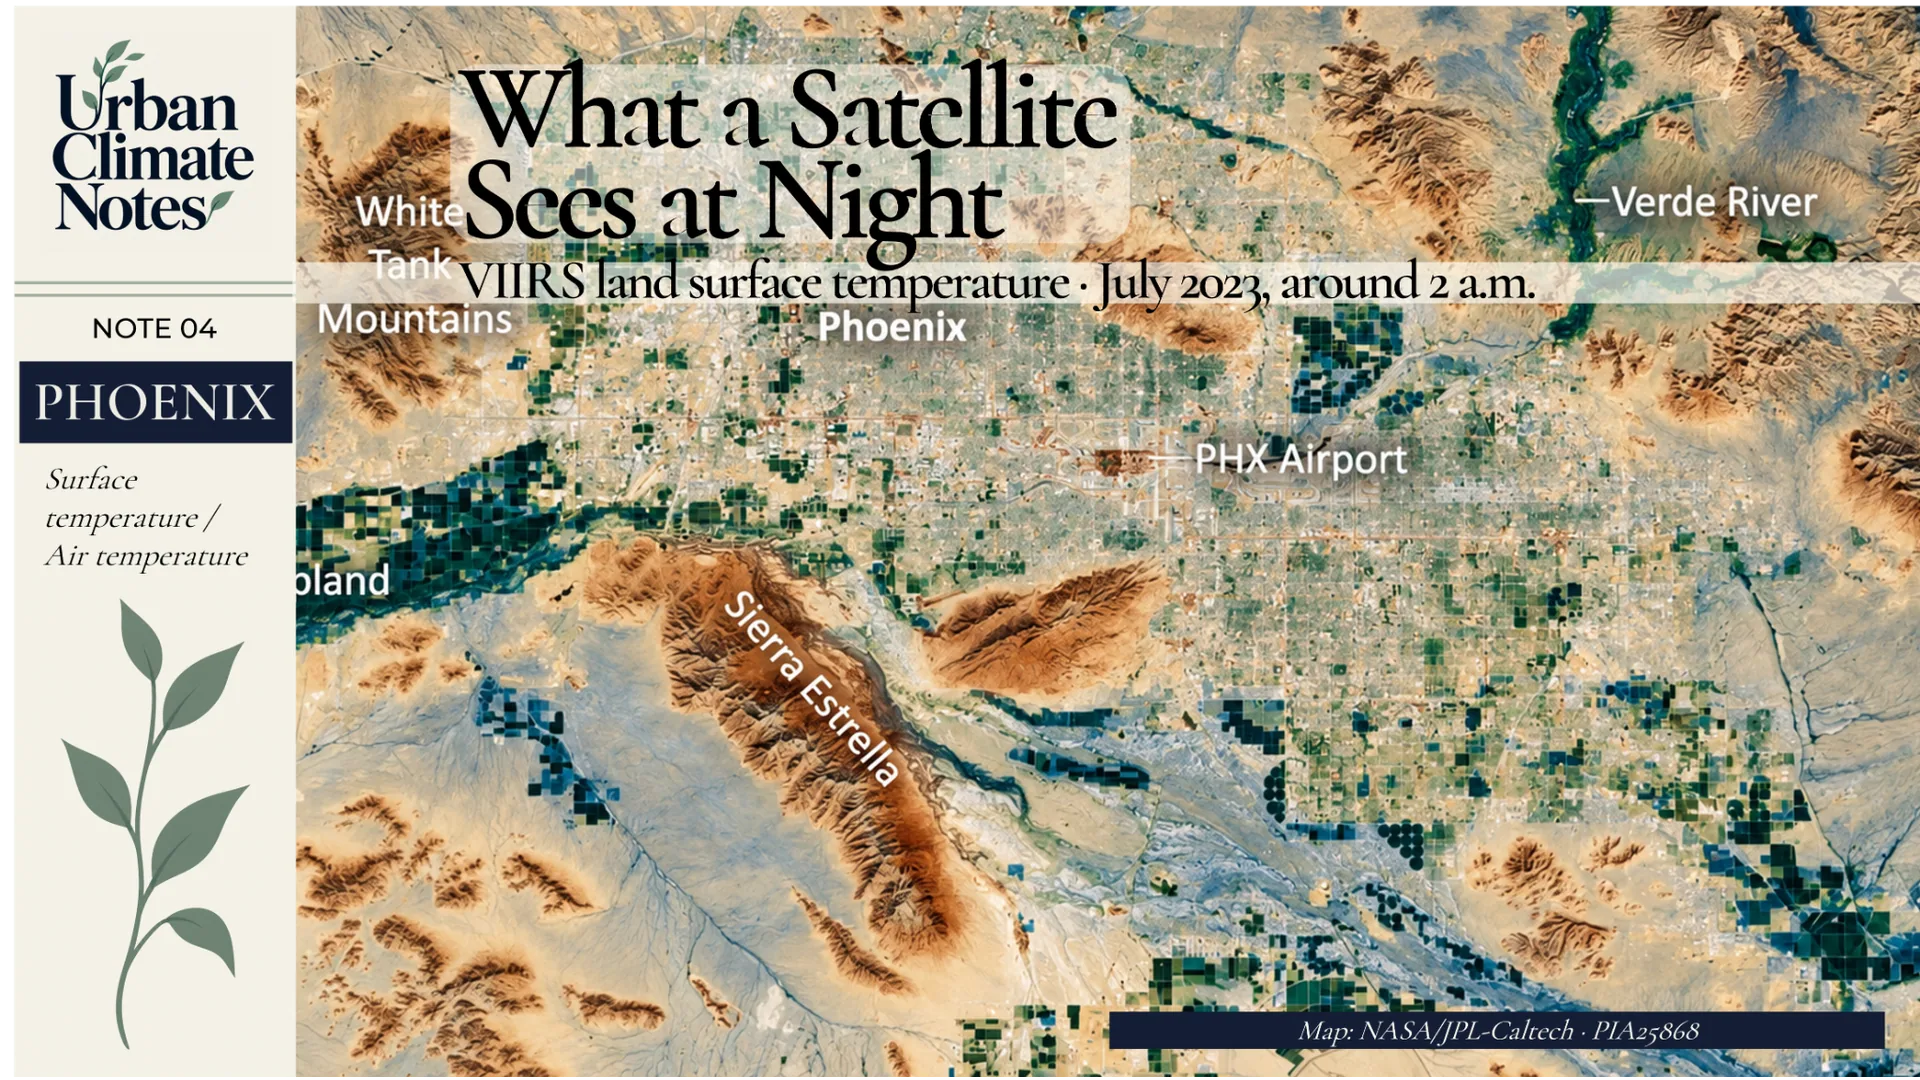
Nighttime land surface temperature in the Phoenix region during the July 2023 heatwave. VIIRS observations were collected at about 2 a.m.; this is not a map of near-surface air temperature. The published graphic should preserve the original NASA map, geographic labels and temperature interpretation. Source: NASA/JPL-Caltech, PIA25868 (VIIRS on NOAA–NASA Suomi NPP).
A pixel is not always an independent observation
The precision of a digital map can also be misleading when pixel size is confused with the sensor's native resolution.
Landsat 8 and 9 collect thermal infrared measurements at a native spatial resolution of 100 metres. Their thermal data are commonly resampled to 30-metre pixels. That output grid does not create independent 30-metre thermal observations. [6]
Phoenix's 2024 ECOSTRESS map involved a different kind of processing: its 30-metre output was sharpened with information from other satellites. Its visual detail should therefore be considered alongside the instrument resolution and the assumptions of the processing method. [2]
Clouds, emissivity, measurement time and retrieval uncertainty matter as well. None is a reason to abandon satellite analysis. They are reasons to describe it accurately.
Which temperature does planning need?
My own research uses satellite LST to investigate relationships among urban morphology, land-cover change and surface heating. Repeated satellite observations make it possible to study redevelopment and vegetation loss across large areas, including places with very few ground-based sensors.
If a wooded parcel is cleared and replaced by buildings and pavement, satellite imagery can help document that physical transformation and the associated changes in surface temperature. If the next question concerns warmer nighttime air around nearby homes, we need air-temperature evidence. If the concern is the experience of pedestrians, shade, radiation and wind deserve closer attention.
These are different planning questions. Each calls for a measurement suited to the decision being made.
Franklin's old warning is worth keeping in mind here. An accurate piece of evidence becomes misleading when we allow it to stand for more than it measures.
I will continue using thermal satellite imagery in my research. But when a map identifies a hot neighbourhood, I want to know which surfaces it is showing, when the observation was taken, and whether it can support a conclusion about the people who live there.
The map tells us where to look. We still have to decide what to measure when we get there.
Sources
[1] Franklin, B. (1758). Poor Richard's Almanack, July: “Half the Truth is often a great Lie.” Historical transcription; Metropolitan Museum of Art.
[2] NASA/JPL-Caltech. (2024). NASA's ECOSTRESS Maps Burn Risk Across Phoenix Streets. NASA Photojournal, PIA25529.
[3] NASA Earth Observatory. Land Surface Temperature.
[4] Zhang, Y., Zhao, L., Chakraborty, T., Mazumdar, P., Zhang, K., & Gentine, P. (2026). Transfer learning reveals large discrepancies between air and land surface temperatures in cities. Nature Communications, 17, 6890.
[5] NOAA National Weather Service. Wet Bulb Globe Temperature vs Heat Index; NOAA Heat Index explanation.
[6] NASA. Landsat 8: Thermal Infrared Sensor; Landsat spectral bands and applications.
[7] NASA/JPL-Caltech. (2023). NASA Data Shows Fierce Surface Temperatures During Phoenix Heat Wave; NASA Photojournal image.
Image sources and use notes
- Cover — Phoenix skyline, 2009: Bigmikebmw, Phoenix, Arizona.JPG, Creative Commons CC BY-SA 3.0. Adaptation: resized/cropped, overlaid title and branding. The edited cover artwork containing this photograph must retain the applicable CC BY-SA 3.0 attribution and share-alike obligations.
- Surface-temperature map — June 2024: NASA/JPL-Caltech, ECOSTRESS PIA25529. Source map with the original legend, time and temperature scale; 1:02 p.m. local time, 19 June 2024. Do not alter its mapped data.
- Large surfaces — Glendale stadium, February 2008: Gerald Nino/U.S. Customs and Border Protection, University of Phoenix Stadium aerial.jpg, U.S. federal public domain. The stadium is in Glendale, within Greater Phoenix. Presentation: resized/cropped and arranged with a separate text panel.
- Neighbourhood aerial — Arizona: Chris The Island, Pexels photo 34873755, Pexels License. Presentation: resized/cropped and arranged with a separate text panel.
- Night surface-temperature map — July 2023: NASA/JPL-Caltech, VIIRS PIA25868. Source map/labels must be preserved; observations around 2 a.m. on selected dates in July 2023.
NASA media-use guidelines apply; NASA did not endorse this article. Each photograph is illustrative unless accompanied by an explicit temperature dataset.